Introduction to the Inspection Report Dashboard
The Inspection Report Dashboard is the default dashboard currently supported in Grid Vision Insight and provides essential KPI information panels and filtering tools to view observation results from selected Asset / Structure inspections for one or more specific Datasets that have been previously completed by a Subject Matter Expert within your organization using Grid Vision Inspect.
Inspection Report Dashboard Layout
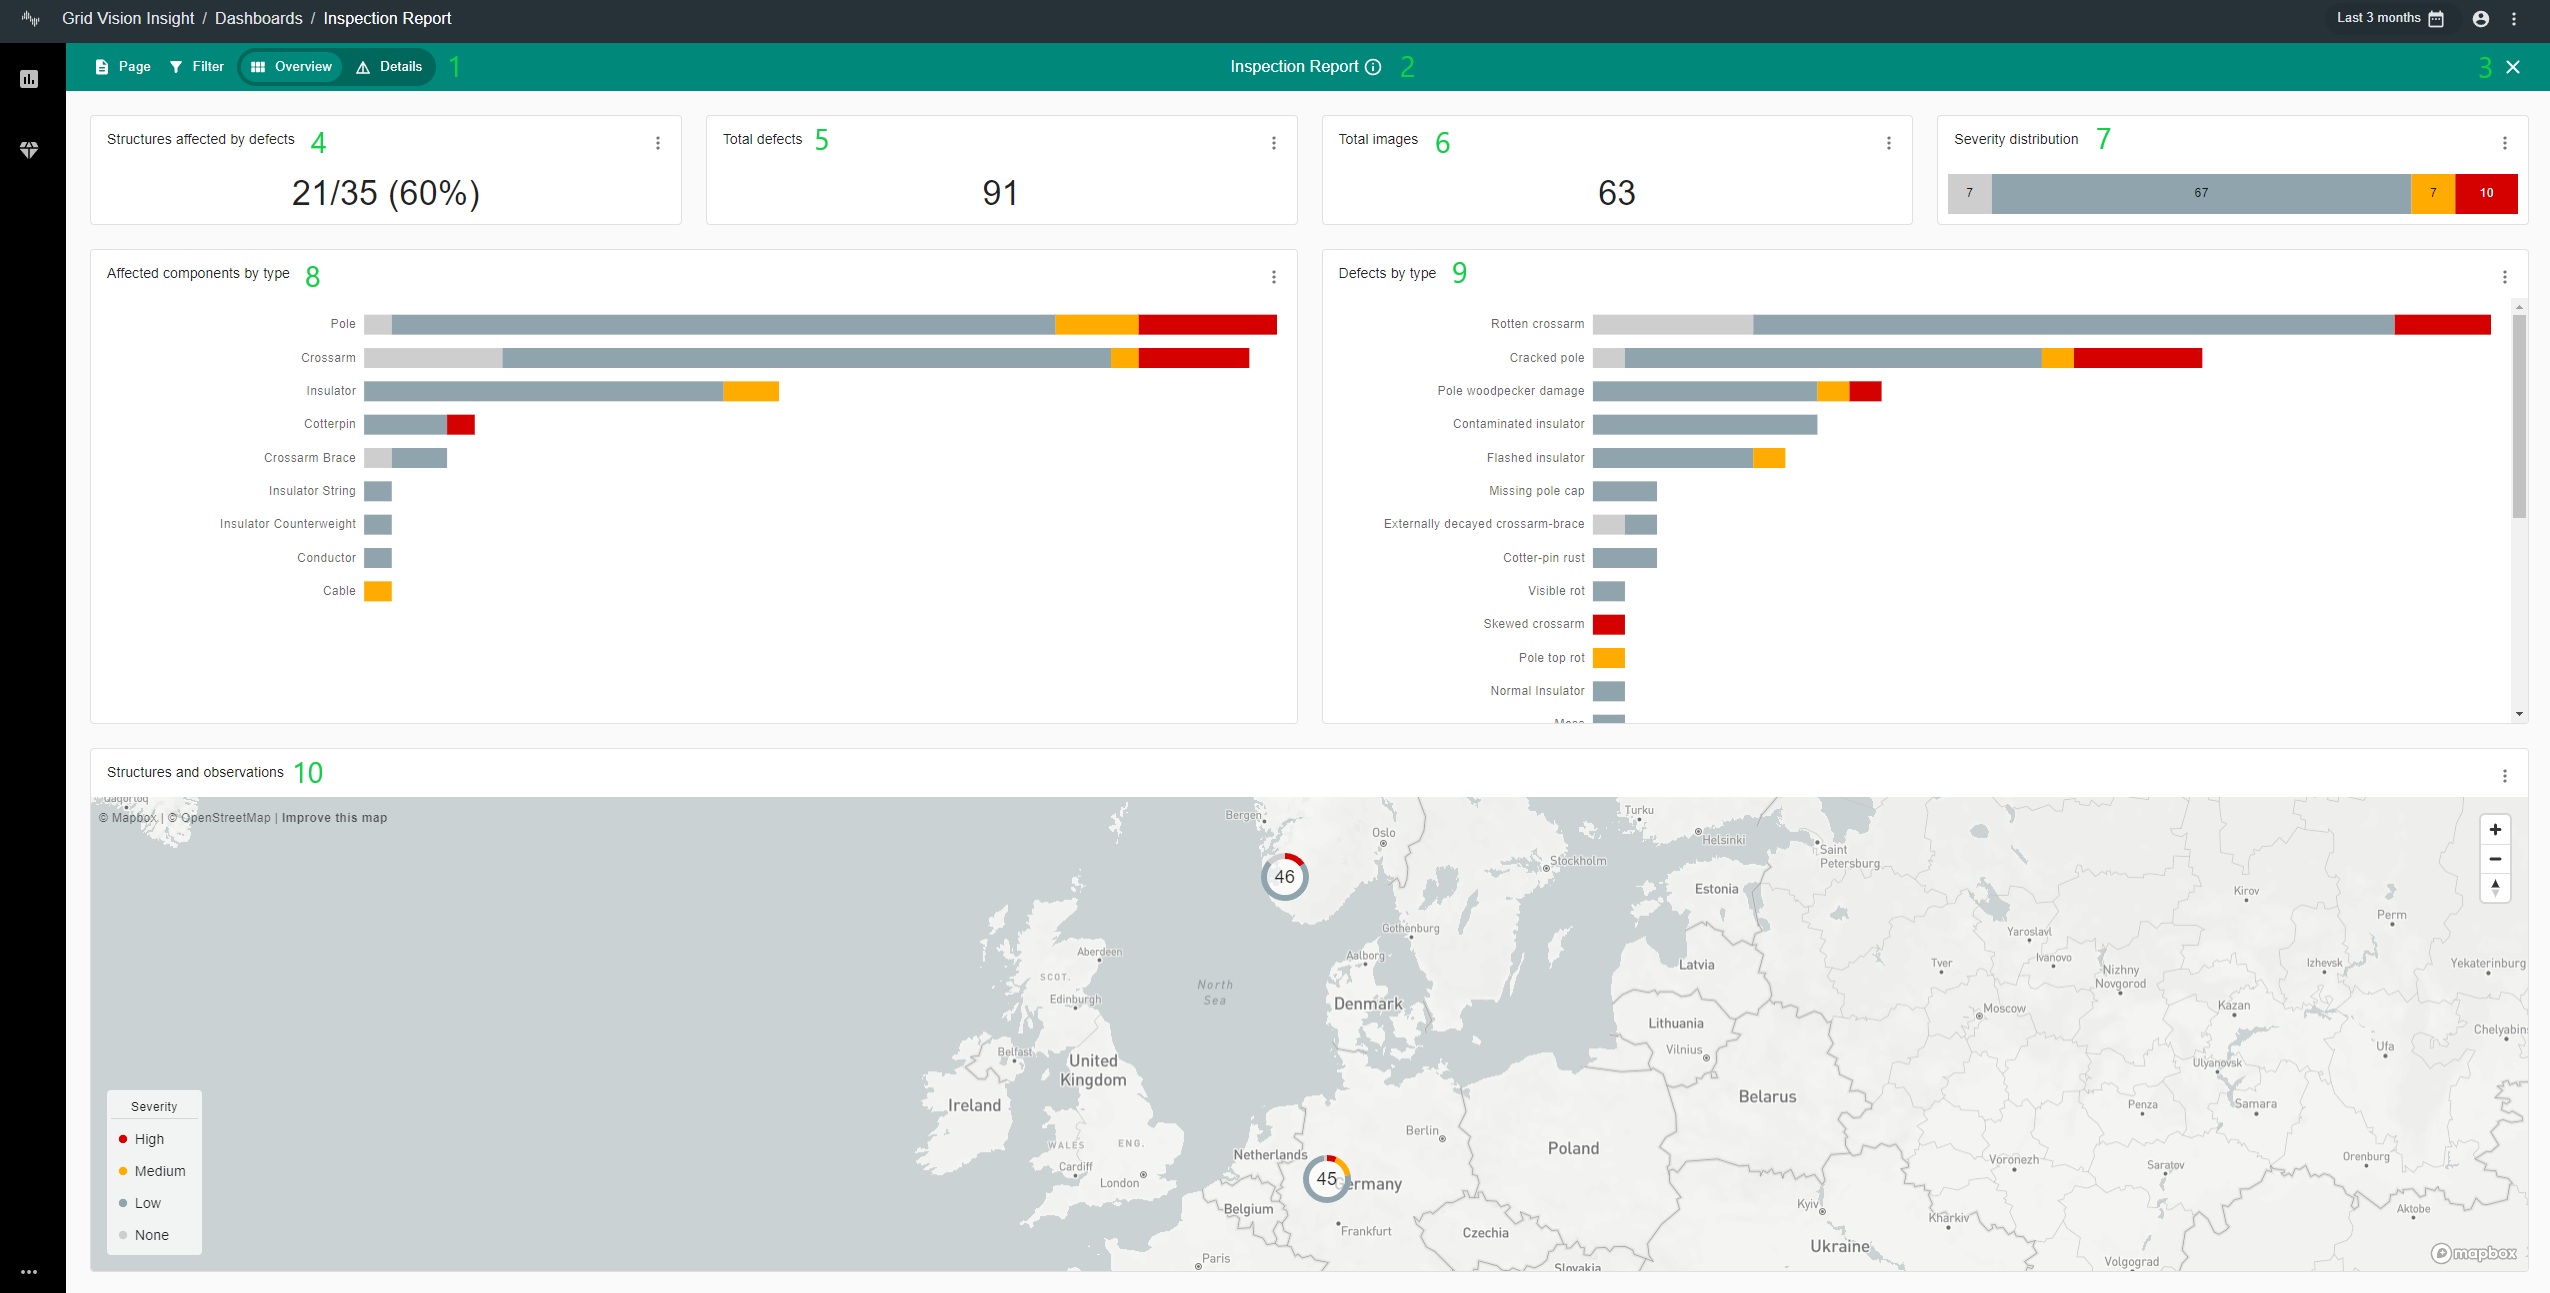
The Inspection Report Dashboard consists of the following interface elements, listed by number according to the numbers shown in the image below:

1. Filter controls and Data View: The two buttons to the left of the top menu bar provide the user with the means to configure the active data selection filter. The two toggle buttons for Overview and Details change the view of the data section below the top KPI panels.
- The "Page" button to the left provides the user with the means to refresh data for the selected page.
- The "Filter" button to the right provides a dropdown list of selectable options to refine the currently retrieved/displayed data shown in the Defect Status Dashboard. By default "All" results are shown for all available datasets for the selected "Participant". Learn more about the selection of Filters here: Applying Filters
2. Inspection Report Status: By selecting the (i) button adjacent to the Inspection Status text, the user can view the "Active Filters" panel, which appears to the right of the screen and can be hidden by selecting the (i) button once more.
The "Active Filters" panel displays all currently applied filters, the user can remove active filters (by selecting "X" on an active filter in the list) from this panel without locating and de-selecting specific filters from wherever they were first applied. The Active Filters panel will update to include any active filters as additional filters are applied.
3. Close Dashboard: Selecting the "X" button will close the Inspection Status Dashboard and return to the user to the Dashboard selection window.
4. Structures affected by defects: This indicator shows the number of structures for the selected dataset (1) or applied filter (default is set to all datasets) that currently have an observed defect. The total amount of asset structures across all datasets (2) for the selected Participant will always be shown. The indicator will be shown as follows: "1 / 2 (3%)" with a percentage value to the side.
5. Total defects: This indicator shows the total number of defects for the selected dataset (default is set to all datasets).
6. Total images: This indicator provides a total number of images captured for the selected dataset (default is set to all datasets).
7. Severity / Priority distribution: This indicator/graph shows how the total number of defects for the selected dataset (default is set to all datasets) are split by their current severity, sorted by, None, Low, Medium and High. Depending on your organizations configuration, values shown here will instead display Priority, sorted by, None, P5, P4, P3, P2 and P1. The user can filter results in the dashboard by clicking a severity bar in this panel to see results for the selected severity. Selecting the bar in the panel once more will remove the selected filter.
8. Affected components by type: This indicator/graph shows the total number of defects for the selected dataset (default is set to all datasets) according to the component that the defect was observed on, for example Pole or Insulator. The user can filter results in the dashboard by clicking on a component bar in this panel to see results for the selected component. Selecting the bar in the panel once more will remove the selected filter. When selecting a component in the panel, results in the "Defects by type" panel will update to show only defect types related to the selected component.
9. Defects by type: This indicator/graph shows the total number of defects for the selected dataset (default is set to all datasets) according to the type of defect observation that has occurred on an asset component, for example a Woodpecker Hole on a Pole or a Flashed Insulator. The user can filter results in the dashboard by clicking on a component bar in this panel to see results for the selected component. Selecting the bar in the panel once more will remove the selected filter. When selecting a defect type in the panel, results in the "Affected components by type" panel will update to show only components related to the type of defect selected.
10. Observations and Structures Map / Table: The Observation and Structures panel will display all inspection results based on the active filter applied by the user (either via the Filter menu or through manipulation of the indicator panels. Results will be displayed in a map format by default or by a Table view when toggled from the associated menu. The Observation and Structures panel results will update automatically any time the user makes a change to the active filter.
The Observations and Structures Map / Table can be viewed in an enlarged view by hiding the "Affected components by type" and "Defects by type" details KPI panels through toggling the display mode with the "Overview / Details" buttons next to the Filter menu buttons.